Why We Built Our Own Error Tracking

This is a technical implementation note about error tracking in Curling IO v3. It is written for software engineers and operators, and goes deeper into Rust, SQLite, durable jobs, source maps, diagnostic safety, and LLM requests than our usual product posts.
A request returning HTTP 500 or a background job failing gives us an error message, but investigating it usually requires more: the producing commit, a source location, the failure chain, the operations that ran before the failure, and enough occurrences to see whether the inputs vary.
Repeated failures need separate handling. One defect inside a loop can produce thousands of reports. We need to retain the occurrence count without sending an alert or making an LLM request for each report.
We could have sent these errors to a hosted error-tracking service. We built a narrower system ourselves for three reasons: data sovereignty, direct integration with our application and operations pipelines, and control over which internal data leaves our infrastructure.
The implementation is split between Curling IO and our separate Operations application. Curling captures a bounded diagnostic envelope without waiting for another service. Operations imports and deduplicates it, sends the alert, asks a fast, lightweight, low-cost LLM for a structured analysis through OpenRouter when that integration is enabled, and stores the result with the issue. The redacted issue record is available through a command and a static report.
What we have to maintain
Owning Operations means owning its bugs, dependency updates, tests, and recovery procedure. We're comfortable with that responsibility because its scope is bounded. We need the checks and diagnostic evidence described here; we're not trying to build every feature of a commercial monitoring platform.
The Rust implementation is documented and tested. ADRs and explicit conventions record the decisions a maintainer needs to understand, and the diagnostic drill checks failure handling without contacting external services. Those supports also make the code easier for agents to investigate and change. That documentation, tooling, and agent support also help when onboarding a new developer. They still need to judge the requirements and review changes.
A hosted service would have maintenance costs too. We'd still own capture, redaction, alert configuration, and integration with our deployment and recovery procedures. We'd also have to respond to API and pricing changes, discontinued features, or the provider changing ownership or shutting down. Keeping this bounded system in-house lets us choose when its interfaces and behavior change.
That doesn't establish higher reliability or remove external dependencies. We still use hosting and notification providers. It gives us control over the monitoring code and diagnostic records, and we think the upkeep is a reasonable price for that control and the fit with our workflows.
Data Sovereignty, Integration, and Security
Data sovereignty
Error reports can contain stack traces, internal file paths, deployment identifiers, integration failures, and selected application context. We keep the primary error record in the Operations SQLite database on our server in Canada. Its replication, backups, retention, and access controls use the same infrastructure boundaries as the rest of Operations data.
A hosted error-tracking service would maintain another copy of that diagnostic archive. Keeping it in Operations means we know where the archive lives, which accounts can read it, how long it is retained, and which recovery process restores it.
Direct integration
First-party ownership lets us shape reports around Curling IO workflows instead of adapting them to a vendor event format. A request failure, background-job panic, handled Mailchimp failure, Stripe reconciliation problem, and browser exception can each include the bounded context appropriate to that boundary.
The stored issue is also easy to connect to other pipelines. The opening email is one durable job. An optional second job builds a redacted prompt, makes one OpenRouter request to a fast, lightweight, low-cost LLM, validates the structured result, and stores it beside the issue.
That LLM request is not an agent run. The model has no coding harness, repository access, tools, write access, or investigation loop. It cannot change code, resolve the issue, or mutate Operations data. It gets one bounded diagnostic record and returns one structured first-pass analysis.
A developer may later choose to give the same issue to a frontier coding agent through a read-only command. That optional second pass is a separate consumer, not part of the automatic alert pipeline. It typically uses a more capable model in a proper coding harness, can inspect the repository and use development tools, and is intended to do the deeper diagnosis when the answer is not already obvious. The issue is also rendered into the static report. None of these paths needs a vendor webhook or a second export format.
Both machine consumers are optional. Without them, Operations still captures and deduplicates errors, sends notifications, and generates the report. We are testing whether the first-pass LLM analysis and the coding-agent bundle reduce the time required to understand and fix an issue.
Security
We do not send the full diagnostic archive, private source maps, request bodies, provider responses, or general service logs to an observability vendor. The capture code accepts specific safe fields, and Operations applies another redaction pass when reading them.
When enabled, AI analysis is an intentional exception to the local boundary. OpenRouter receives one bounded diagnostic prompt for an eligible issue, not access to the Operations database or error archive. The request disables storage and asks for zero-data-retention routing. The model returns a fixed structured analysis, and that result is stored in Operations. This is not the same as keeping every byte inside our infrastructure, but it lets us choose exactly what crosses the boundary for each analysis call.
Scope
This covers application error tracking. It does not include performance monitoring, session replay, general log search, or distributed tracing.
The stored data is selected for debugging. It includes the full producing Git commit rather than only a display release, a bounded sequence of application operations, and separate generated and original JavaScript locations. It does not include data needed only for performance charts or replay.
A frontier coding agent is an optional downstream consumer of the data, separate from the first-pass LLM request. When a problem is not already obvious, a developer can choose to give the issue bundle to an agent that uses a more capable model and a proper coding harness. It can inspect the producing revision, form a hypothesis, change the relevant workflow, and write a regression test. The bundle includes the deployment and failure context that we would otherwise have to assemble manually.
The issue record is organized around that purpose:
| Evidence | Purpose |
|---|---|
| Full producing commit | Opens the exact code that emitted the error |
| Original and generated source locations | Separates reliable evidence from source-map interpretation |
| Error kind, cause chain, and trace | Identifies the failing boundary and nested cause |
| Request or job identity | Locates the workflow without copying customer input |
| Ordered breadcrumbs | Reconstructs what the application did before it failed |
| Representative occurrences | Shows meaningful variation without flooding context |
| Stored first-pass LLM analysis | Gives the investigation an initial hypothesis, not an answer |
| Explicit missing context | Stops unavailable logs or maps from looking like empty evidence |
When present, the first-pass analysis is stored beside these fields rather than replacing them. The captured error message, cause chain, stack trace, context, and occurrences remain available whether the analysis succeeds or not. A developer or coding agent can check its hypothesis against that underlying evidence.
Applications Write to a Local Handoff
Curling does not call Operations, Postmark, or an LLM while handling the failing request or job.
The application writes a bounded diagnostic envelope to a local handoff. A separate Operations worker imports those envelopes once a minute. If Operations is unavailable, the original request still returns its original result and a background job still follows its own retry or failure policy.
This is also used for handled failures. A Mailchimp member sync may fail for one account while later accounts can still be processed. A Stripe recovery job may confirm that a payment succeeded remotely but fail while finalizing the local order. The business workflow owns whether it can continue, retry, reconcile, or stop. Error reporting records the evidence. It does not make the business decision.
Reporter failures are contained. A full handoff directory, malformed envelope, or unavailable Operations database does not recursively create another wave of reports.
Captured Context and Redaction
Serializing the request, job payload, local variables, and provider response would copy credentials, personal information, payment details, and arbitrary customer input into a second database and a model request.
Each producing boundary defines its safe context.
Request reports retain the matched route, method, status, correlation ID, and safe source evidence. They do not retain raw paths, query strings, form values, or request bodies. Integration reports can include a provider request ID, status code, and retry stage, but not credentials, account email addresses, or provider response bodies.
Each request and job also carries a small ordered breadcrumb trail. A breadcrumb names an application operation, its outcome, elapsed time, and a few whitelisted scalar fields. The producer keeps the newest 16 events within 4 KiB. Unknown keys and nested values are dropped.
A failed checkout might retain this sequence:
+0 ms     http.request    started
+5,000 ms database.write failed    status=busy
This records which operation failed and how long it ran without storing the order form or customer record.
Operations redacts the evidence again when it builds the diagnostic bundle. This protects readers from mistakes in current or historical producers.
Deduplication and LLM Request Limits
Each request is cheap. Thousands of them are not. A simple error inside a tight loop is the main cost risk.
Operations groups occurrences into an issue using the application, environment, full producing commit, and a normalized error fingerprint. The build is part of the identity because an investigation must start from the code that actually ran. A new deployment creates a new issue instead of quietly mixing evidence from two revisions.
Volatile values such as numeric identifiers are normalized before fingerprinting. One reconciliation loop that fails for item 1001 and then item 1002 should normally be one issue with two occurrences, not two issues.
The database enforces one analysis job for each issue and prompt version. A thousand repeated reports therefore produce:
1,000 occurrences
1 deduplicated issue
1 opening notification
1 LLM analysis job
Deduplication is not enough protection. A broken fingerprint or a broad outage could create many distinct issues at once, so the worker starts analysis for at most 10 new deduplicated issues in any rolling hour. Excess analyses are marked as skipped. They do not form an expensive backlog that wakes up later and drains the account after the outage is already understood.
Ten is intentionally unsophisticated. If more than ten genuinely different errors appear in an hour, we probably have a larger incident and do not need a model to explain every symptom. If bad normalization created the extra issues, we need to fix the normalization, not pay for the noise.
Notification and Analysis Jobs
Notification and analysis are separate durable jobs.
The worker processes the opening email first. That email says AI analysis is pending and goes out even if the model credential is unavailable, the provider is down, or the hourly analysis budget is exhausted. The analysis runs afterward with extra-high reasoning, and its structured result is attached to the same issue in SQLite.
This uses a fast, lightweight, low-cost LLM, not an agent. It receives one bounded diagnostic record and returns a summary, likely cause, suggested fix, confidence, supporting evidence, and missing context. If the evidence does not support a reasonable diagnosis, the confidence and missing-context fields should say so. A suggested fix is only a suggestion. The model has no write access and cannot edit code, resolve the issue, deploy a fix, or make a business decision. We use extra-high reasoning for this request without moving it to a heavier model.
The optional second pass comes later, if a developer decides the issue needs more work. A frontier coding agent can use its more capable model and coding harness to verify the first-pass analysis against the source, trace, breadcrumbs, and producing commit. If the analysis is wrong, disabled, or unavailable, the issue and alert still contain the captured evidence.
Provider failures use bounded retries. A worker restart can recover a stale claim, and a permanently failed analysis is not reopened every time another occurrence arrives. One claimed attempt makes at most one LLM request.
The processing order is:
- Preserve the failure.
- Send the alert.
- Analyze it asynchronously when eligible.
- Make the evidence and analysis available for investigation.
The email path does not depend on analysis completion.
Browser Errors and Source Maps
Uncaught JavaScript exceptions and unhandled promise rejections use the same issue model, with one additional problem: the browser reports a location in a generated asset.
Curling sends bounded browser reports to a same-origin endpoint. The server
adds the trusted build identity before writing the handoff envelope. Production
source maps are private release artifacts with sourcesContent removed, and
Operations uses a map only when its manifest matches the occurrence's full Git
commit.
When mapping succeeds, the issue keeps both locations:
generated: /assets/islands/checkout.js:42:7
original:  apps/curling/platform/src/islands/checkout.ts:118:14
When mapping fails, the generated evidence remains usable and the issue records
an explicit status such as release_missing, map_missing, or unmapped.
An unavailable mapping remains unavailable rather than being presented as an
original TypeScript location.
Browser capture has its own per-page and server-hour limits. Those limits contain reload loops before Operations deduplication and the hourly LLM analysis budget even come into play.
A Command and a Static Report
One issue can be retrieved through a bounded JSON command. It opens the Operations database read-only and returns the exact producing commit, source locations, first and latest occurrence, up to five meaningfully different occurrences, breadcrumbs, safe context, and stored analysis. It is used for command-line investigation. A developer's coding agent can call the command to receive that bounded bundle without receiving general access to the Operations database.
The static report presents the same record as an index and one detail page per issue.
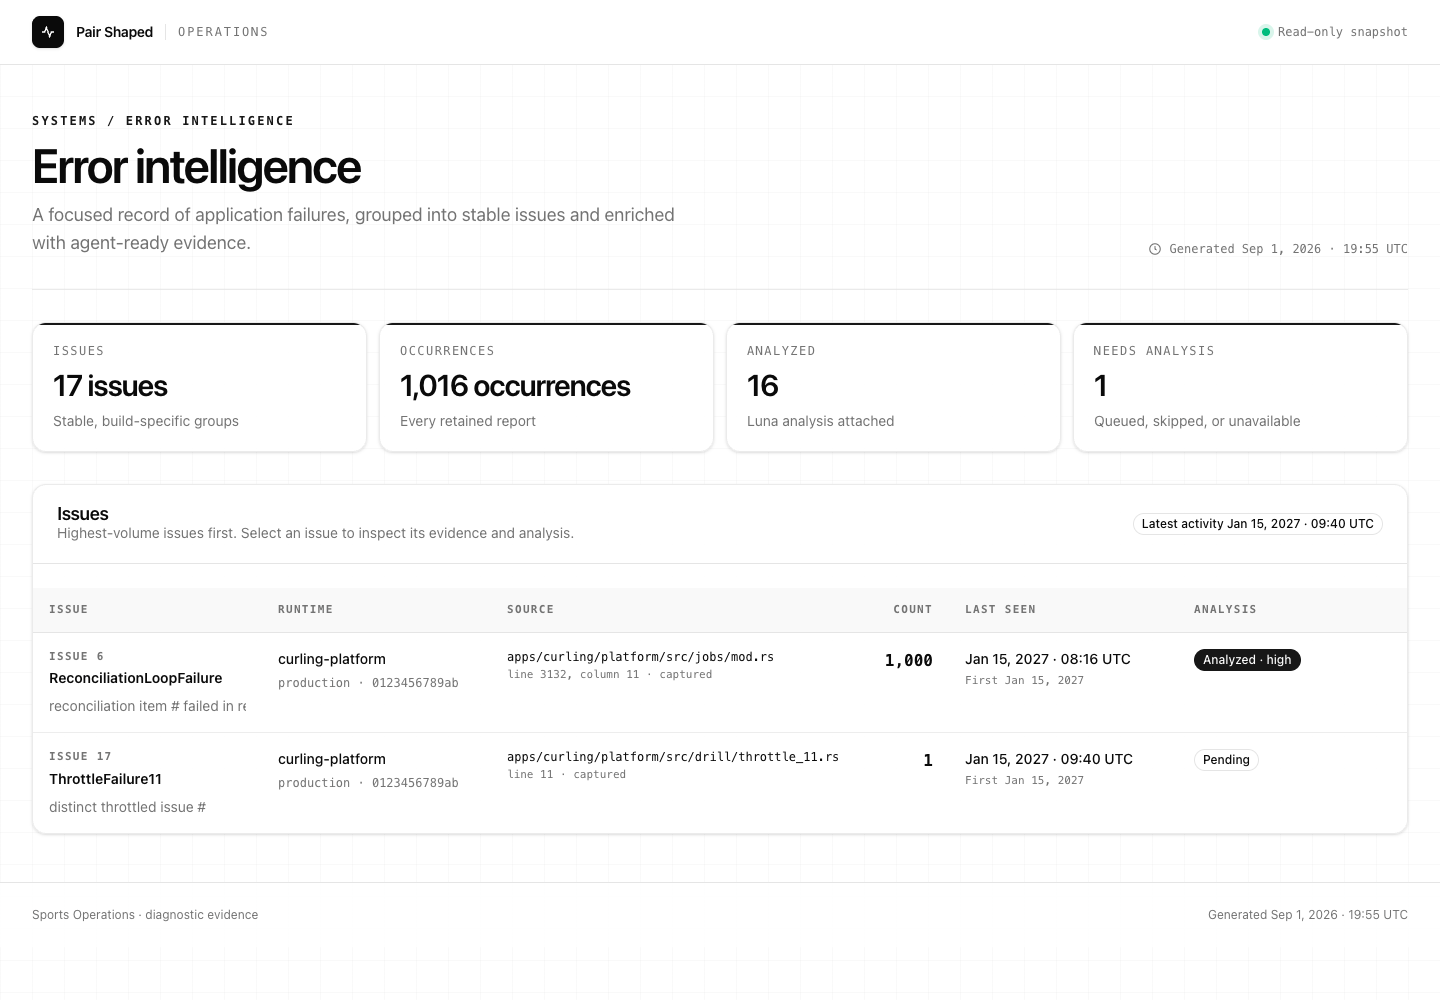
The report is rendered in Rust using the same Basecoat and Tailwind setup as the Curling site. It contains no client JavaScript and has no write actions. The generator stages the complete output before replacing the previous report, and fingerprints the issue data and stylesheet. If nothing changed, it leaves the existing files alone.
The report has no write endpoint. Marking an issue resolved and authorizing a repair belong to explicit Operations commands with narrower permissions. Serving and authentication are separate deployment concerns.
The Diagnostic Drill
The implementation has a no-network diagnostic drill that creates plausible failures and runs the whole workflow against a temporary Operations database. It includes:
- an HTTP request that times out on a database write;
- an unhandled background-job panic;
- a handled Mailchimp synchronization failure;
- a Stripe payment that succeeds remotely but fails during local finalization;
- a browser exception with generated source evidence;
- a 1,000-occurrence reconciliation loop; and
- enough distinct issues to cross the 10-per-hour LLM analysis limit.
The drill sends no email and makes no LLM request. Fake Postmark and analysis boundaries record what would have happened, including the structured analysis. It asserts the stored issues, job counts, notification order, redaction, source-map status, throttle behavior, and final diagnostic bundle.
The report screenshot above comes from that fixture: 17 issues and 1,016 occurrences, with 16 fake analyses attached and one skipped by the hourly limit. These counts verify the loop and throttle behavior rather than only the single-error path.